ArtsAutosBooksBusinessEducationEntertainmentFamilyFashionFoodGamesGenderHealthHolidaysHomeHubPagesPersonal FinancePetsPoliticsReligionSportsTechnologyTravel

How To Make a Graph with the Appearance of Massive Growth by Changing the Rise and Run

Updated on May 21, 2012

How To Make Graphs Tell a Story in Powerpoint

Graphs are a powerful marketing tool since the image can tell an amazing story. In the case of many web 2.0 companies, you may have seen the story of Twitters amazing growth. However, you have to really read the numbers - I’m not saying Twitters growth isn’t crazy impressive, just that graphs can tell a story to your eyes, but if you read the data it’s actually very different.

HubPages has had excellent growth since it’s launch in August 2006. Google analytics shows that HubPages has nearly 14 million visitors per month and nearly 40 million page views. I’m putting a presentation on HubPages together that shows the growth of Hubs and how it correlates to page view growth. The three images below have the exact same data, all on the same scale. The only difference is the rise and run of the graph are changed based on how I format the graph to the slide. I'd like to have some room on the slide for bullet points. See how different the story looks based on how I format the graph.

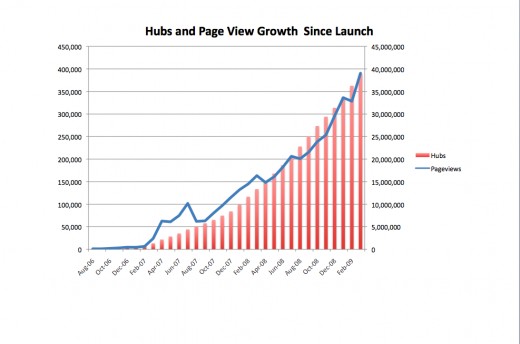
1. The first image shows how the graph looks when you paste it directly from Excel to Powerpoint. It shows excellent growth, but there’s not much room to write bullets for the slide. Let’s see what the graph looks like if I decrease the rise (vertical height) of the graph.

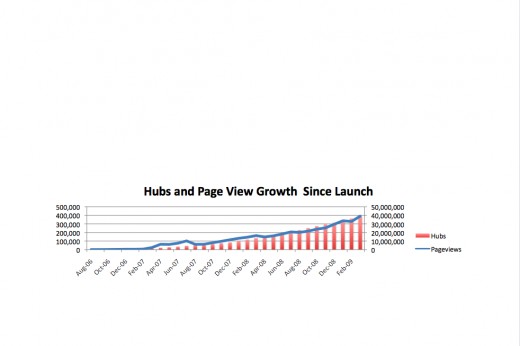
Decreasing the vertical height of the Y axis

2. Image two shows that I’ve decreased the rise of the graph. I now have a nice space above for bullets. But. The graph doesn’t illustrate the excellent growth of HubPages. Note the data is absolutley the same between the first image and the second. Let’s see how the graph looks if I decrease the run of the slide so I have room to the side for bullet points…

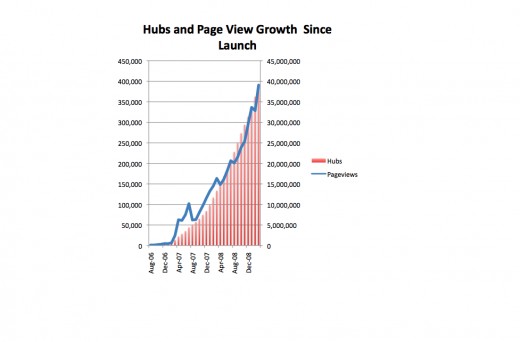
Decreasing the horizontal width of the X axis

3. The image below is the exact same data as the data in the first images, but I’ve decreased the run (X axis). By decreasing the run of the graph, it gives the appearance of much more dramatic growth. This is the power of appearance.

working

This website uses cookies

As a user in the EEA, your approval is needed on a few things. To provide a better website experience, hubpages.com uses cookies (and other similar technologies) and may collect, process, and share personal data. Please choose which areas of our service you consent to our doing so.

For more information on managing or withdrawing consents and how we handle data, visit our Privacy Policy at: https://corp.maven.io/privacy-policy

Show Details
Necessary
HubPages Device IDThis is used to identify particular browsers or devices when the access the service, and is used for security reasons.
LoginThis is necessary to sign in to the HubPages Service.
Google RecaptchaThis is used to prevent bots and spam. (Privacy Policy)
AkismetThis is used to detect comment spam. (Privacy Policy)
HubPages Google AnalyticsThis is used to provide data on traffic to our website, all personally identifyable data is anonymized. (Privacy Policy)
HubPages Traffic PixelThis is used to collect data on traffic to articles and other pages on our site. Unless you are signed in to a HubPages account, all personally identifiable information is anonymized.
Amazon Web ServicesThis is a cloud services platform that we used to host our service. (Privacy Policy)
CloudflareThis is a cloud CDN service that we use to efficiently deliver files required for our service to operate such as javascript, cascading style sheets, images, and videos. (Privacy Policy)
Google Hosted LibrariesJavascript software libraries such as jQuery are loaded at endpoints on the googleapis.com or gstatic.com domains, for performance and efficiency reasons. (Privacy Policy)
Features
Google Custom SearchThis is feature allows you to search the site. (Privacy Policy)
Google MapsSome articles have Google Maps embedded in them. (Privacy Policy)
Google ChartsThis is used to display charts and graphs on articles and the author center. (Privacy Policy)
Google AdSense Host APIThis service allows you to sign up for or associate a Google AdSense account with HubPages, so that you can earn money from ads on your articles. No data is shared unless you engage with this feature. (Privacy Policy)
Google YouTubeSome articles have YouTube videos embedded in them. (Privacy Policy)
VimeoSome articles have Vimeo videos embedded in them. (Privacy Policy)
PaypalThis is used for a registered author who enrolls in the HubPages Earnings program and requests to be paid via PayPal. No data is shared with Paypal unless you engage with this feature. (Privacy Policy)
Facebook LoginYou can use this to streamline signing up for, or signing in to your Hubpages account. No data is shared with Facebook unless you engage with this feature. (Privacy Policy)
MavenThis supports the Maven widget and search functionality. (Privacy Policy)
Marketing
Google AdSenseThis is an ad network. (Privacy Policy)
Google DoubleClickGoogle provides ad serving technology and runs an ad network. (Privacy Policy)
Index ExchangeThis is an ad network. (Privacy Policy)
SovrnThis is an ad network. (Privacy Policy)
Facebook AdsThis is an ad network. (Privacy Policy)
Amazon Unified Ad MarketplaceThis is an ad network. (Privacy Policy)
AppNexusThis is an ad network. (Privacy Policy)
OpenxThis is an ad network. (Privacy Policy)
Rubicon ProjectThis is an ad network. (Privacy Policy)
TripleLiftThis is an ad network. (Privacy Policy)
Say MediaWe partner with Say Media to deliver ad campaigns on our sites. (Privacy Policy)
Remarketing PixelsWe may use remarketing pixels from advertising networks such as Google AdWords, Bing Ads, and Facebook in order to advertise the HubPages Service to people that have visited our sites.
Conversion Tracking PixelsWe may use conversion tracking pixels from advertising networks such as Google AdWords, Bing Ads, and Facebook in order to identify when an advertisement has successfully resulted in the desired action, such as signing up for the HubPages Service or publishing an article on the HubPages Service.
Statistics
Author Google AnalyticsThis is used to provide traffic data and reports to the authors of articles on the HubPages Service. (Privacy Policy)
ComscoreComScore is a media measurement and analytics company providing marketing data and analytics to enterprises, media and advertising agencies, and publishers. Non-consent will result in ComScore only processing obfuscated personal data. (Privacy Policy)
Amazon Tracking PixelSome articles display amazon products as part of the Amazon Affiliate program, this pixel provides traffic statistics for those products (Privacy Policy)
ClickscoThis is a data management platform studying reader behavior (Privacy Policy)